Fig. 9
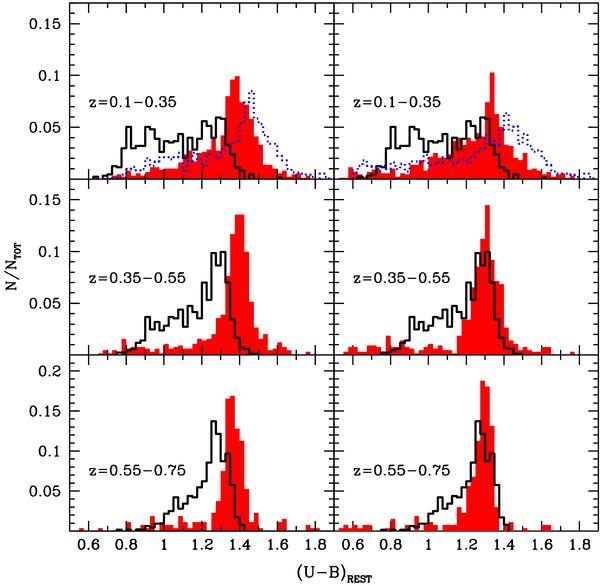
Rest-frame U−B colour distribution in a mass-limited sample (using the most conservative limit, see text) in different redshift bins, as observed (solid black histogram for the total population) and predicted using the “SFH-evolution” from the previous higher redshift bin (red filled histogram). The dotted blue histogram in the top panels represent the expected z = 0 colour distribution by applying the “SFH-evolution” to the galaxies in the first redshift bin. Left panels: assuming no evolution in the dust content, i.e., the same dust content derived from the SED fitting at the observed redshift; right panels: assuming no dust content in the evolved galaxies.
Current usage metrics show cumulative count of Article Views (full-text article views including HTML views, PDF and ePub downloads, according to the available data) and Abstracts Views on Vision4Press platform.
Data correspond to usage on the plateform after 2015. The current usage metrics is available 48-96 hours after online publication and is updated daily on week days.
Initial download of the metrics may take a while.