Fig. 8
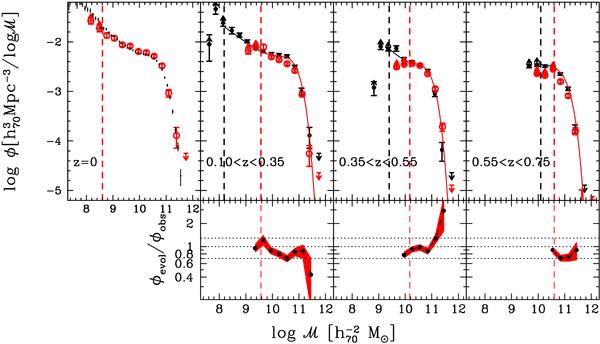
Upper panels: “SFH-evolved GSMF” (empty red points) compared to observed GSMF at redshift z (black filled points, from Fig. 4). In the first panel, we plot the GSMF evolved from the first redshift bin to z = 0 (empty red points), compared with the local GSMF (Baldry et al. 2008, shown as small dots). Vertical lines represent the respective mass limits. Lower panels: ratio of “SFH-evolved GSMF” to observed GSMF (both estimated using 1/Vmax technique). The dotted lines correspond to ± 30% around 1.
Current usage metrics show cumulative count of Article Views (full-text article views including HTML views, PDF and ePub downloads, according to the available data) and Abstracts Views on Vision4Press platform.
Data correspond to usage on the plateform after 2015. The current usage metrics is available 48-96 hours after online publication and is updated daily on week days.
Initial download of the metrics may take a while.