Fig. 4
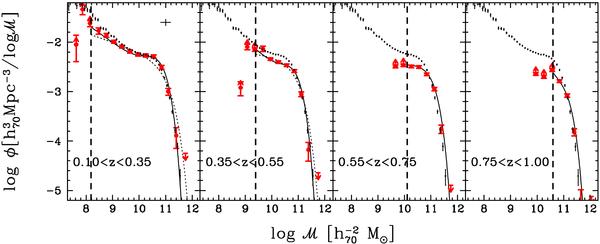
Global galaxy stellar mass functions in four different redshift bins. Red filled points represent 1/Vmax determination and associated Poisson errors, while the lines represent the Schechter fits. The global GSMFs are not reproduced well by a single Schechter function (dotted lines), but by two Schechter functions (continuous lines) up to z = 0.55. In the first two redshift bins, the GSMFs show the inflection points of the bimodality around ℳ ~ 5 × 10⁹ ℳ⊙. The dashed vertical lines represent the mass limit in the corresponding redshift bin (ℳmin). Data are plotted as lower limits below ℳmin. Upper limits at 1σ (i.e. 1.84 objects) are shown at the high-mass end. Small black dots in all panels represent the local GSMF by Baldry et al. (2008). The cross at the right top of the first panel shows an estimate of the cosmic variance and mass uncertainties.
Current usage metrics show cumulative count of Article Views (full-text article views including HTML views, PDF and ePub downloads, according to the available data) and Abstracts Views on Vision4Press platform.
Data correspond to usage on the plateform after 2015. The current usage metrics is available 48-96 hours after online publication and is updated daily on week days.
Initial download of the metrics may take a while.