Fig. 21
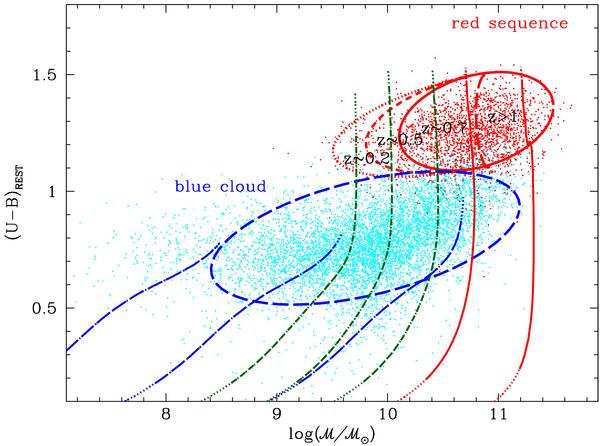
Schematic scenario for galaxy evolution. Different ellipses refer to different redshifts and galaxy populations, while different evolutionary tracks are plotted between 0.1 and 10 Gyr and refer to SFHs with different timescales and normalized to the total final mass ((τ; log (ℳtot/ℳ⊙)) = (0.1;11.5), (0.3;11.0) [solid red curves]; (0.6;10.7), (1;10.3), (2;10.0) [short dashed green curves]; (5;11), (10;10), (15;9) [long dashed blue curves].
Current usage metrics show cumulative count of Article Views (full-text article views including HTML views, PDF and ePub downloads, according to the available data) and Abstracts Views on Vision4Press platform.
Data correspond to usage on the plateform after 2015. The current usage metrics is available 48-96 hours after online publication and is updated daily on week days.
Initial download of the metrics may take a while.