Fig. 19
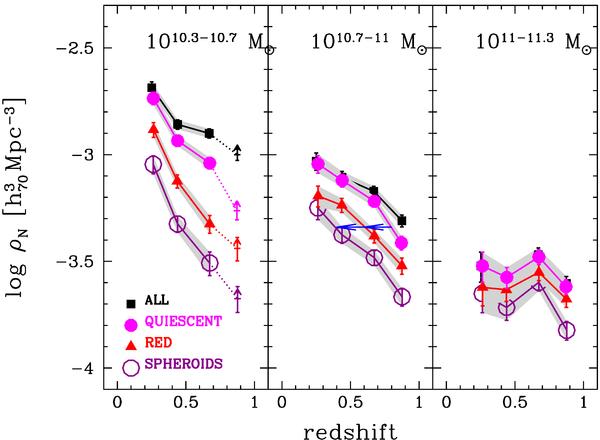
Number density evolution for ETGs in different mass ranges: red galaxies (red
filled triangles for  = 1), spheroidals (dark
magenta empty circles for
= 1), spheroidals (dark
magenta empty circles for  =
1 + 2.0) and low-SSFR (magenta filled circles for
log(SSFR) < −1). Black filled squares refer to the
global population. Lines have the same meaning as in Fig. 11. In the second panel, we also indicate by 2
arrows the evolutionary time sequence from quiescent to red to spheroidal galaxies
(see text).
=
1 + 2.0) and low-SSFR (magenta filled circles for
log(SSFR) < −1). Black filled squares refer to the
global population. Lines have the same meaning as in Fig. 11. In the second panel, we also indicate by 2
arrows the evolutionary time sequence from quiescent to red to spheroidal galaxies
(see text).
Current usage metrics show cumulative count of Article Views (full-text article views including HTML views, PDF and ePub downloads, according to the available data) and Abstracts Views on Vision4Press platform.
Data correspond to usage on the plateform after 2015. The current usage metrics is available 48-96 hours after online publication and is updated daily on week days.
Initial download of the metrics may take a while.