Fig. 18
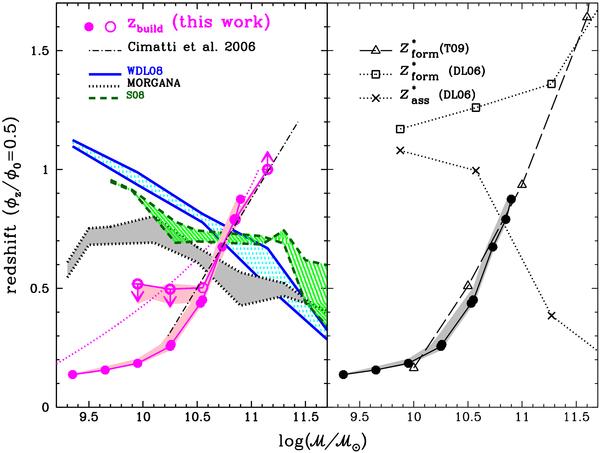
Redshift at which the ETG GSMF has decreased by a factor 2 (φz/φ0 = 0.5, i.e., zbuilding, see text) as a function of ℳ. Left panel: circles magenta points refer to data derived within zCOSMOS for passive galaxies (log (SSFR/Gyr-1) < −2): open circles have been derived completely from zCOSMOS dataset, using as a reference the GSMF in the first redshift bin (φ0 = φ(z ~ 0.24), along with the region covered using various ETG classification criteria; filled circles are zbuilding using the local ETG GSMF (see text), along with the spread in its shape related to their enviroment. Dotted magenta curve shows the ℳmin above which we are formally complete. Also plotted are zbuilding from SAMs: WDL08 (shaded region bounded by solid blue lines), S08 (shaded region bounded by dashed green lines), and MORGANA (shaded region bounded by dotted black lines), derived using the original GSMF or convolved with 0.25 dex in mass uncertainties (see Fontanot et al. 2009). Right panel: zbuilding for zCOSMOS data points are compared with the trend with stellar mass of the median zassembly and zform (80% of star assembled and formed, respectively) from De Lucia et al. (2006, DL06) and with the redshift at which the stellar formation ends (80% of star formed) in local ETGs estimated by Thomas et al. (2009, T09).
Current usage metrics show cumulative count of Article Views (full-text article views including HTML views, PDF and ePub downloads, according to the available data) and Abstracts Views on Vision4Press platform.
Data correspond to usage on the plateform after 2015. The current usage metrics is available 48-96 hours after online publication and is updated daily on week days.
Initial download of the metrics may take a while.