Fig. 15
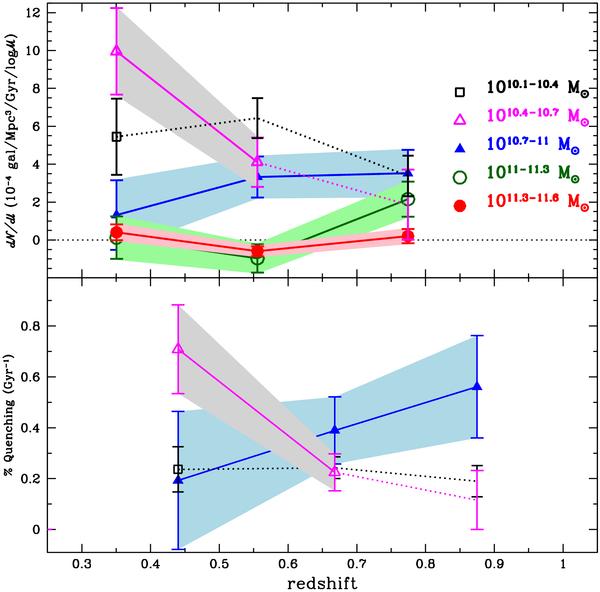
Evolution of the growth rate in number density
 (top panel) as a function of redshift for red galaxies
(
(top panel) as a function of redshift for red galaxies
( = 1) in different mass
ranges (represented by different symbols and colours). Values have been plotted at the
intermediate redshift between two adjacent redshift bins. In the bottom
panel, we show the evolution with redshift of the fraction of blue galaxies
( = 2−4) that are
transforming into red galaxies per Gyr (see text). In all the panels, hatched regions
refer to GSMFs that are complete in the mass range and redshift
considered, while dotted lines are connecting points at redshifts where the
GSMF is not complete in the considered mass range.
= 1) in different mass
ranges (represented by different symbols and colours). Values have been plotted at the
intermediate redshift between two adjacent redshift bins. In the bottom
panel, we show the evolution with redshift of the fraction of blue galaxies
( = 2−4) that are
transforming into red galaxies per Gyr (see text). In all the panels, hatched regions
refer to GSMFs that are complete in the mass range and redshift
considered, while dotted lines are connecting points at redshifts where the
GSMF is not complete in the considered mass range.
Current usage metrics show cumulative count of Article Views (full-text article views including HTML views, PDF and ePub downloads, according to the available data) and Abstracts Views on Vision4Press platform.
Data correspond to usage on the plateform after 2015. The current usage metrics is available 48-96 hours after online publication and is updated daily on week days.
Initial download of the metrics may take a while.