Fig. 13
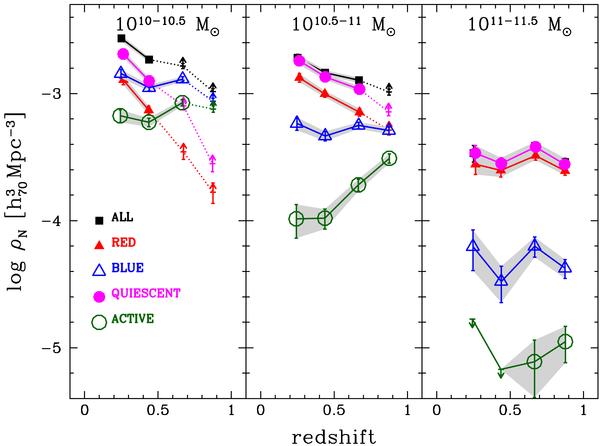
Number density evolution in different mass ranges. Different symbols and colours refer to different population classes: black squares refers to the total population, empty red and filled blue triangles to SED-ETGs and SED-LTGs using photometric classification, while filled magenta and empty green circles refer to quiescent and active populations, respectively. Hatched regions refer to GSMF complete in the mass range and redshift considered, while dotted lines and lower limits are plotted at redshifts where the GSMF is not complete in the considered mass range. (A color version of this figure is available in the online version of the article.)
Current usage metrics show cumulative count of Article Views (full-text article views including HTML views, PDF and ePub downloads, according to the available data) and Abstracts Views on Vision4Press platform.
Data correspond to usage on the plateform after 2015. The current usage metrics is available 48-96 hours after online publication and is updated daily on week days.
Initial download of the metrics may take a while.