Fig. 10
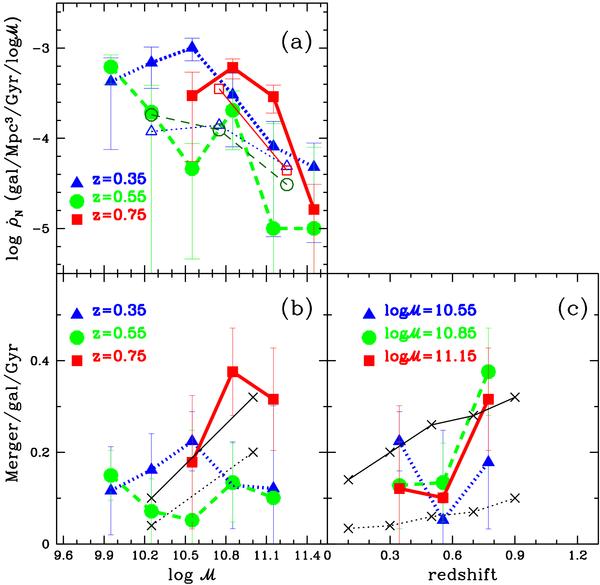
Panel a): growth rate in number density after accounting for star formation evolution. Different thick lines and filled colour points represent estimates at different redshifts (dotted, dashed and solid for z ~ 0.35,0.55, and 0.75, respectively). For comparison, thin lines and empty points are the major merger rate estimates by de Ravel et al. (2010). Panel b): merger per Gyr per galaxy as a function of mass. Same lines and points as in panel a). Predictions based on cosmological simulations from Stewart et al. (2009), for mergers with mass ratio m/ℳ > 0.1, are plotted as thin lines and black cross for the lowest and highest redshift bin. Panel c): merger per Gyr per galaxy as a function of redshift. Thick lines and points represent various mass ranges (dotted, dashed and solid for log (ℳ/ℳ⊙) ~ 10.55,10.85,11.15, respectively). Predictions from Stewart et al. (2009) for m/ℳ > 0.1 are plotted as thin lines and black cross for log (ℳ/ℳ⊙) ~ 10.3 (dotted line) and log (ℳ/ℳ⊙) > 11 (solid line).
Current usage metrics show cumulative count of Article Views (full-text article views including HTML views, PDF and ePub downloads, according to the available data) and Abstracts Views on Vision4Press platform.
Data correspond to usage on the plateform after 2015. The current usage metrics is available 48-96 hours after online publication and is updated daily on week days.
Initial download of the metrics may take a while.