Fig. 1
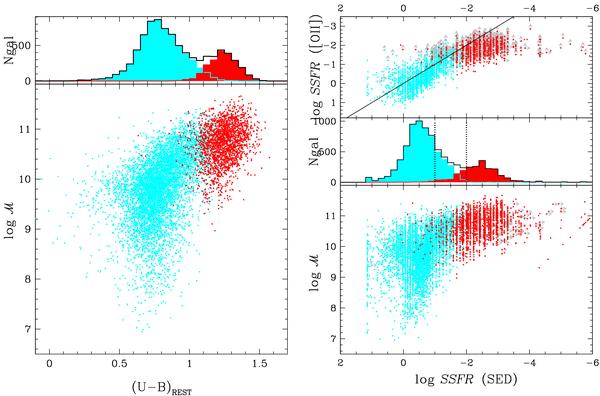
Left figure: the
upper panel shows the U−B
rest-frame colour distribution of galaxies with different photometric
types. The bottom panel shows the colour-mass
diagram. Right figure: SSFR of galaxies with
different photometric types. The upper panel
shows the comparison between estimates from the SED fitting and
from [OII] for galaxies in the range
0.5 < z < 0.9. The middle panel
shows the SSFR distribution of galaxies, along with
the two dotted lines used to separate active from quiescient
(log (SSFR/Gyr-1) = −1) or from passive
galaxies (log (SSFR/Gyr-1) = −2). The bottom
panel shows the log (SSFR/Gyr-1)-mass diagram. Red
dark and light cyan colours represent SED-ETGs ( = 1) and SED-LTGs
( = 2−4),
respectively. (A color version of this figure is available in the online version
of the article.)
= 1) and SED-LTGs
( = 2−4),
respectively. (A color version of this figure is available in the online version
of the article.)
Current usage metrics show cumulative count of Article Views (full-text article views including HTML views, PDF and ePub downloads, according to the available data) and Abstracts Views on Vision4Press platform.
Data correspond to usage on the plateform after 2015. The current usage metrics is available 48-96 hours after online publication and is updated daily on week days.
Initial download of the metrics may take a while.