Fig. 4
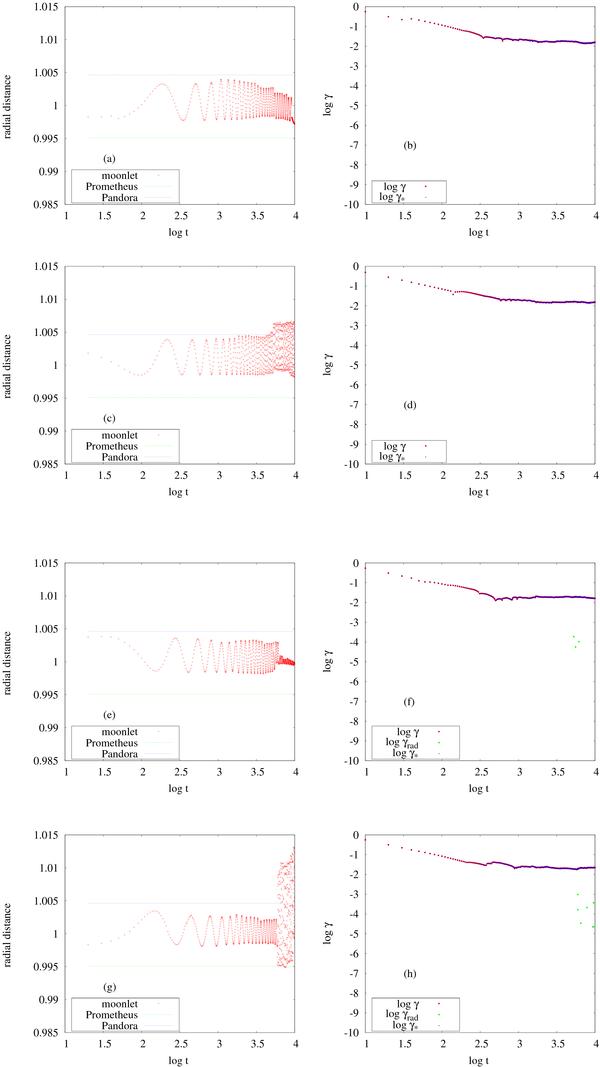
Results for four moonlets disturbed by the satellites Prometheus and Pandora, examples A, B, C, and D, from the first to the fourth lines, respectively. The plots in the first column show the temporal evolution in the orbital radius of each moonlet. The unit of distance in these plots is normalized such that the mean orbital radius of the F ring is equal to one. The green and blue lines indicate the mean orbital radius of the satellites Prometheus and Pandora, respectively. The plots in the second column show the Lyapunov characteristic exponent of each moonlet. Three computations are shown: (1) the complete LCE, given by γ (in red); (2) the contribution of the radial component, given by γrad (in green); (3) the LCE without the radial contribution, given by γ∗ (in blue). In the examples A and B, the green dots, associated with γrad, do not appear in the plot because their values are several orders of magnitude smaller than the lower limit of the vertical axis.
Current usage metrics show cumulative count of Article Views (full-text article views including HTML views, PDF and ePub downloads, according to the available data) and Abstracts Views on Vision4Press platform.
Data correspond to usage on the plateform after 2015. The current usage metrics is available 48-96 hours after online publication and is updated daily on week days.
Initial download of the metrics may take a while.