Fig. 3
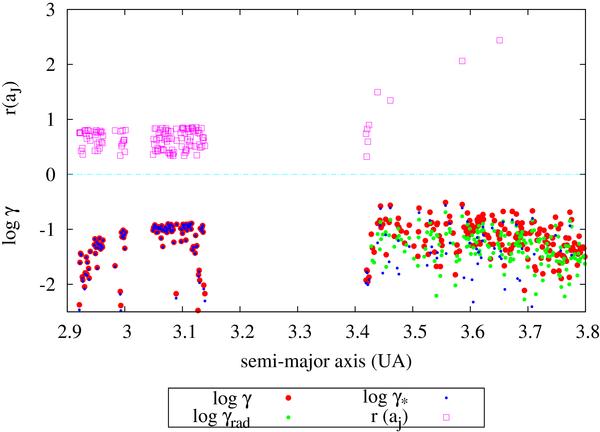
Overview of the results for the sample of simulations for asteroids disturbed by Jupiter. In this plot, we consider only the data concerning the asteroids with short Lyapunov time (of just a few hundred years). This figure is divided by the light blue line into two parts, in the vertical axis: (1) positive values indicate the final orbital radius of the asteroid (pink), in units of Jupiter’s orbital radius, and (2) negative values indicate the logarithm of Lyapunov characteristic exponent of the asteroid, where (i) the complete LCE, given by γ, is in red; (ii) the contribution of the radial component, given by γrad, is in green; and (iii) the LCE without the radial contribution, given by γ∗, is in blue. The horizontal axis indicates the initial semi-major axis of the asteroid.
Current usage metrics show cumulative count of Article Views (full-text article views including HTML views, PDF and ePub downloads, according to the available data) and Abstracts Views on Vision4Press platform.
Data correspond to usage on the plateform after 2015. The current usage metrics is available 48-96 hours after online publication and is updated daily on week days.
Initial download of the metrics may take a while.