Fig. 4
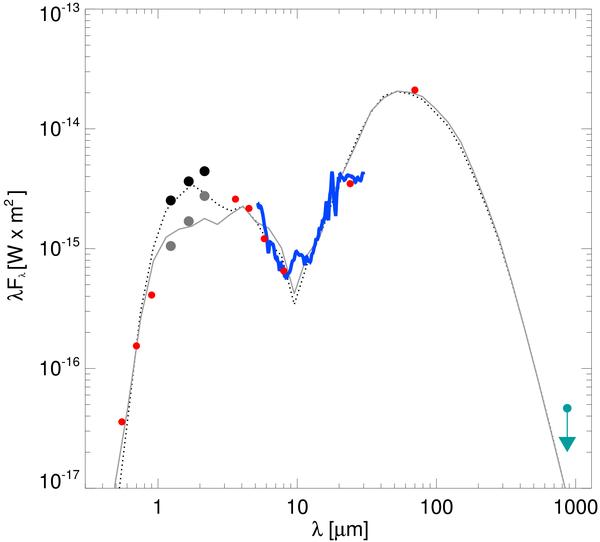
Observed SED of Par-Lup3-4. The circles show all photometric measurements. For the near-IR regime, the black circles represent 2MASS data, and the grey ones C03 data. The strong variability is responsible for the dispersion of the measurements taken at these wavelengths. The Spitzer IRS spectrum is shown in blue color. The best-fit models from our Bayesian analysis are represented by dotted (2MASS) and solid (C03) lines.
Current usage metrics show cumulative count of Article Views (full-text article views including HTML views, PDF and ePub downloads, according to the available data) and Abstracts Views on Vision4Press platform.
Data correspond to usage on the plateform after 2015. The current usage metrics is available 48-96 hours after online publication and is updated daily on week days.
Initial download of the metrics may take a while.