Fig. 2
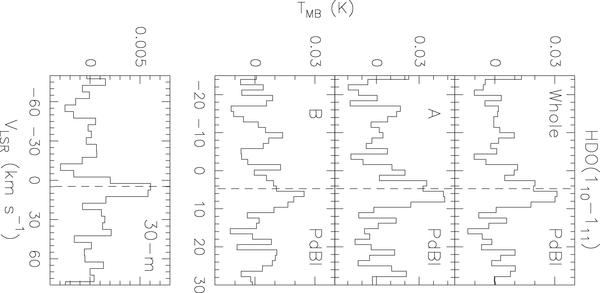
HDO(110–111) spectra (in TB scale) derived from the PdBI image and integrated over the whole emitting region (upper panel), and the area of the two structures called A and B (middle panels). The spectral resolution is 1.4 km s-1. Bottom panel reports the HDO(110–111) low-spectral resolution (5 km s-1) spectrum as observed with the 30-m IRAM antenna. The ambient LSR velocity (+4.7 km s-1) is marked by the vertical dashed line.
Current usage metrics show cumulative count of Article Views (full-text article views including HTML views, PDF and ePub downloads, according to the available data) and Abstracts Views on Vision4Press platform.
Data correspond to usage on the plateform after 2015. The current usage metrics is available 48-96 hours after online publication and is updated daily on week days.
Initial download of the metrics may take a while.