Fig. 1
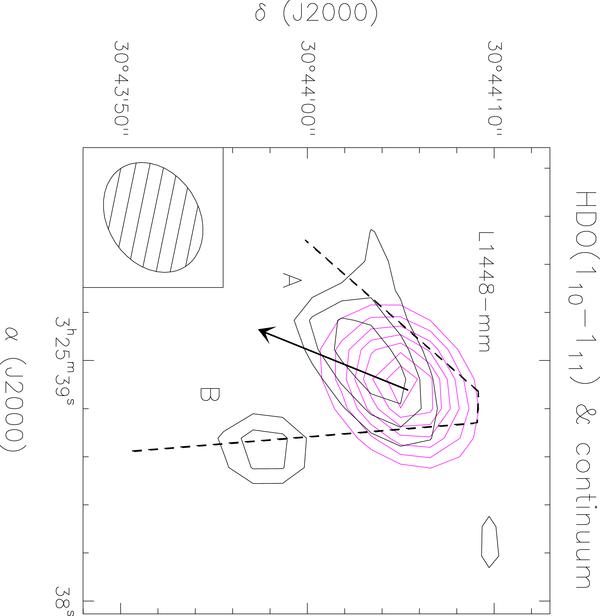
Contour map of the HDO(110–111) emission (black contours) integrated between –0.3 and +10.7 km ss-1 superimposed onto the continuum image at 3.7 mm (magenta). The HDO contour levels range from 3σ (33 mJy km s-1 beam-1) to 5σ by 1σ. Continuum contour levels range from 30 (~20σ) to 90% of the peak value (16 mJy), and identify the driving protostar L1448-mm. The filled ellipse in the lower left corner shows the synthesised PdBI beam (HPBW): 6″̣29 × 4″̣87. The black arrow points in the direction of the jet (PA = –21°) identified by Guilloteau et al. (1992) through SiO emission. The dashed lines identify the sketch of the limits of the conical blue-shifted (+6, +8 km s-1) cavity observed in CO(1–0) at PdBI by Bachiller et al. (1995).
Current usage metrics show cumulative count of Article Views (full-text article views including HTML views, PDF and ePub downloads, according to the available data) and Abstracts Views on Vision4Press platform.
Data correspond to usage on the plateform after 2015. The current usage metrics is available 48-96 hours after online publication and is updated daily on week days.
Initial download of the metrics may take a while.