Free Access
Fig. 5
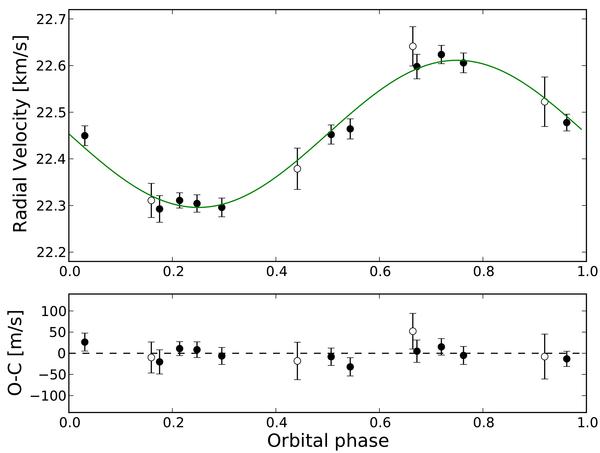
Upper panel: radial Velocity measurements phased to the orbital period measured by CoRoT. The solid curve represents the best-fit solution. Lower panel: residuals to the fit. In both panels, the white symbols indicate the measurements that have been corrected for moonlight contamination.
Current usage metrics show cumulative count of Article Views (full-text article views including HTML views, PDF and ePub downloads, according to the available data) and Abstracts Views on Vision4Press platform.
Data correspond to usage on the plateform after 2015. The current usage metrics is available 48-96 hours after online publication and is updated daily on week days.
Initial download of the metrics may take a while.