Fig. 4
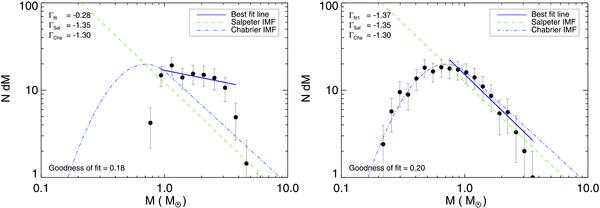
The initial mass function of the simulations at t = tff. Left panel shows the IMF for simulation A, and the right panel shows the IMF for simulation B. The green dashed line represents the Salpeter function. The blue dot-dashed line represents the Chabrier IMF, as fitted to simulation B. A power-law fit is applied to the data above the turn-over mass, ~1.2 M⊙ left and ~0.7 M⊙ right, and is shown as the solid purple line.
Current usage metrics show cumulative count of Article Views (full-text article views including HTML views, PDF and ePub downloads, according to the available data) and Abstracts Views on Vision4Press platform.
Data correspond to usage on the plateform after 2015. The current usage metrics is available 48-96 hours after online publication and is updated daily on week days.
Initial download of the metrics may take a while.