Fig. 1
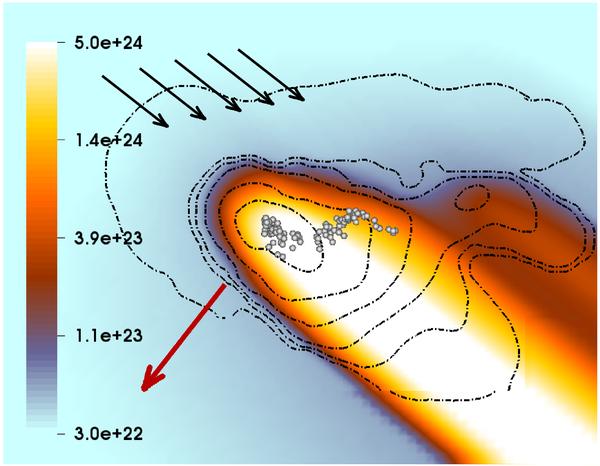
Column density (cm-2) slice of simulation A at t = tff. The colors represent the column density along the line of sight to the black hole, which is located at the upper left side (the black arrows indicate the direction of radiation). The density is shown in black contours. Contour levels are 1, 4, 16, 64, 256, 1024 × 104 cm-3. The white spheres display the location of the sink particles and the red arrow indicates the direction of the cloud’s orbital motion.
Current usage metrics show cumulative count of Article Views (full-text article views including HTML views, PDF and ePub downloads, according to the available data) and Abstracts Views on Vision4Press platform.
Data correspond to usage on the plateform after 2015. The current usage metrics is available 48-96 hours after online publication and is updated daily on week days.
Initial download of the metrics may take a while.