Free Access
Fig. 4
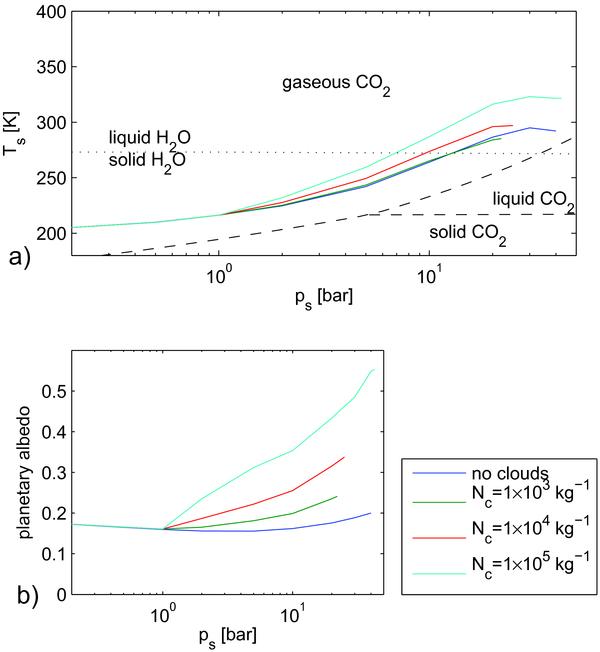
a) Surface temperature vs. surface pressure for pure CO2 atmospheres under M-class insolation with CO2 cloud radiative effects included. Dashed and dotted lines show CO2 and H2O phase transitions, respectively. b) Planetary albedo vs. surface pressure for the same simulations as in a).
Current usage metrics show cumulative count of Article Views (full-text article views including HTML views, PDF and ePub downloads, according to the available data) and Abstracts Views on Vision4Press platform.
Data correspond to usage on the plateform after 2015. The current usage metrics is available 48-96 hours after online publication and is updated daily on week days.
Initial download of the metrics may take a while.