Fig. 10
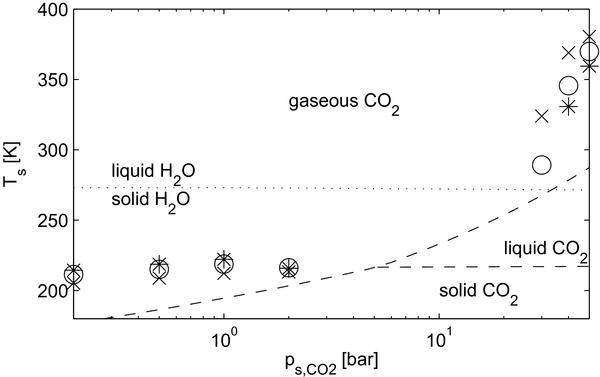
Surface temperature vs. surface pressure for the “most conservative case” described in the text. Dashed and dotted lines show CO2 and H2O phase transitions, respectively, while crosses, circles and stars indicate surface temperatures for atmospheres with H2O clouds of opacity τ = 1, 2 and 3, respectively. In this figure, the x-axis shows the CO2 partial pressure.
Current usage metrics show cumulative count of Article Views (full-text article views including HTML views, PDF and ePub downloads, according to the available data) and Abstracts Views on Vision4Press platform.
Data correspond to usage on the plateform after 2015. The current usage metrics is available 48-96 hours after online publication and is updated daily on week days.
Initial download of the metrics may take a while.