Fig. 1
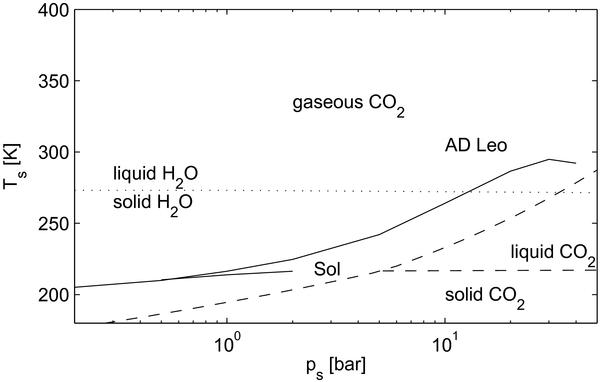
Surface temperature vs. surface pressure for clear pure CO2 atmospheres under G-class (Sol) and M-class (AD Leo) stellar insolation. Dashed and dotted lines show CO2 and H2O phase transitions, respectively. In the G-class case, the line is discontinued because the atmosphere condenses on the surface for pressures greater than a few bar.
Current usage metrics show cumulative count of Article Views (full-text article views including HTML views, PDF and ePub downloads, according to the available data) and Abstracts Views on Vision4Press platform.
Data correspond to usage on the plateform after 2015. The current usage metrics is available 48-96 hours after online publication and is updated daily on week days.
Initial download of the metrics may take a while.