Fig. 4
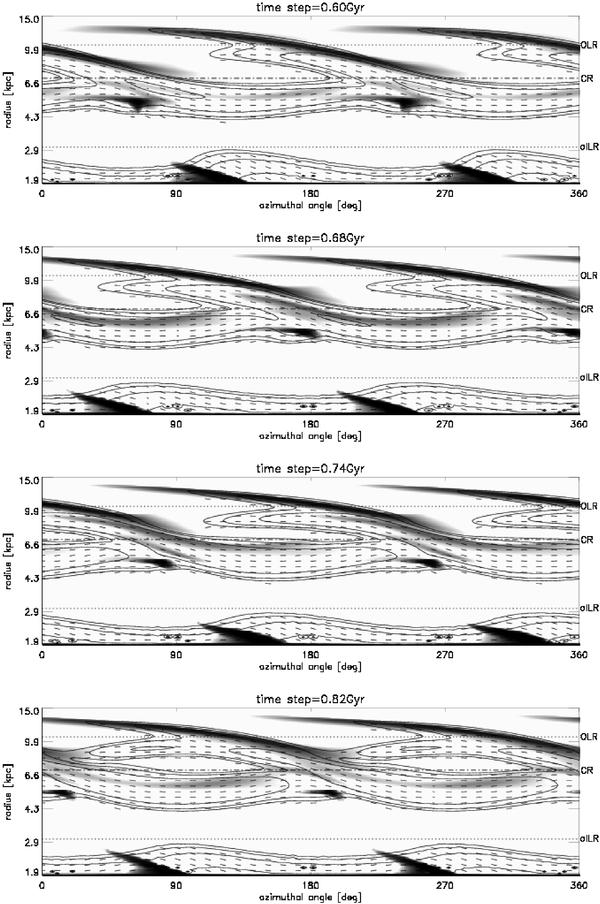
Polarized intensity (contours) and polarization angles (dashes) for model omb25cs07 superimposed onto the gas density (grey-scale, integrated along the line of sight) shown in the azimuth-log(r) frame at selected time steps. The co-rotation radius and two of the Lindblad resonances are shown as dash-dotted line and dotted line respectively.
Current usage metrics show cumulative count of Article Views (full-text article views including HTML views, PDF and ePub downloads, according to the available data) and Abstracts Views on Vision4Press platform.
Data correspond to usage on the plateform after 2015. The current usage metrics is available 48-96 hours after online publication and is updated daily on week days.
Initial download of the metrics may take a while.