Fig. 3
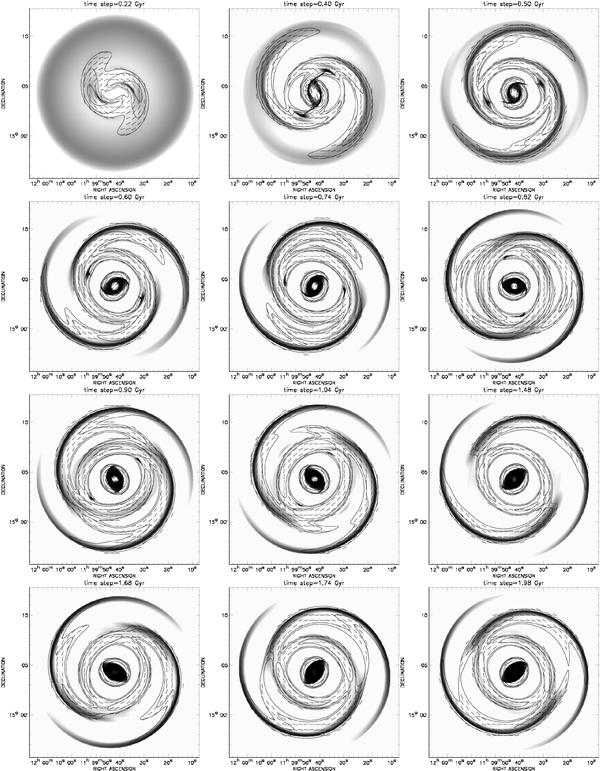
Face-on polarization maps for selected times steps for model omb25cs07. Polarized intensity (contours) and polarization angles (dashes) are superimposed onto column density plots (grey-scale). All maps have been smoothed to the resolution 40''. The black color represents the regions with the highest density.
Current usage metrics show cumulative count of Article Views (full-text article views including HTML views, PDF and ePub downloads, according to the available data) and Abstracts Views on Vision4Press platform.
Data correspond to usage on the plateform after 2015. The current usage metrics is available 48-96 hours after online publication and is updated daily on week days.
Initial download of the metrics may take a while.