Free Access
Fig. 1
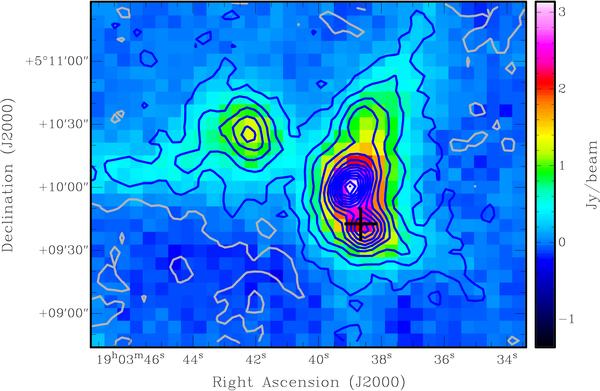
The 870 μm LABOCA image of source 38.92–0.36 is shown in color, overlaid on which is the 1.2 mm MAMBO image in green contours. The contours start at 10% of the peak emission (550 mJy/beam) in steps of 5% thereafter. The black cross shows the location of the methanol maser.
Current usage metrics show cumulative count of Article Views (full-text article views including HTML views, PDF and ePub downloads, according to the available data) and Abstracts Views on Vision4Press platform.
Data correspond to usage on the plateform after 2015. The current usage metrics is available 48-96 hours after online publication and is updated daily on week days.
Initial download of the metrics may take a while.