Fig. 7
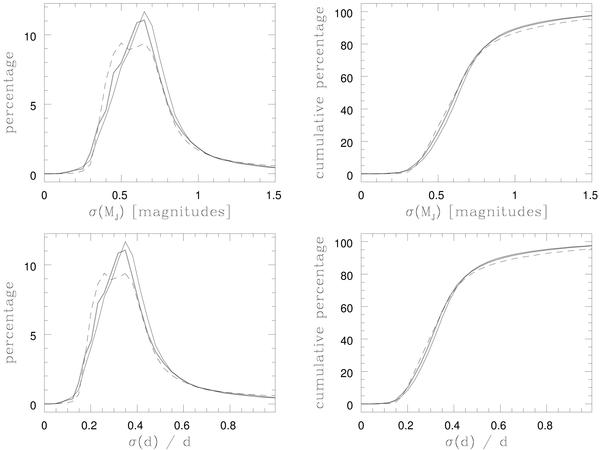
Formal error distribution histogram (left) and cumulative plot (right) for absolute J magnitude (top) and distance (bottom). Black lines are for YY isochrones, grey ones for Dartmouth, and the dashed ones for the Padova ones. The histograms have bin widths of 0.05 mag and include 235064 spectra that have S / N > 20 and do not show any peculiarities.
Current usage metrics show cumulative count of Article Views (full-text article views including HTML views, PDF and ePub downloads, according to the available data) and Abstracts Views on Vision4Press platform.
Data correspond to usage on the plateform after 2015. The current usage metrics is available 48-96 hours after online publication and is updated daily on week days.
Initial download of the metrics may take a while.