Fig. 6
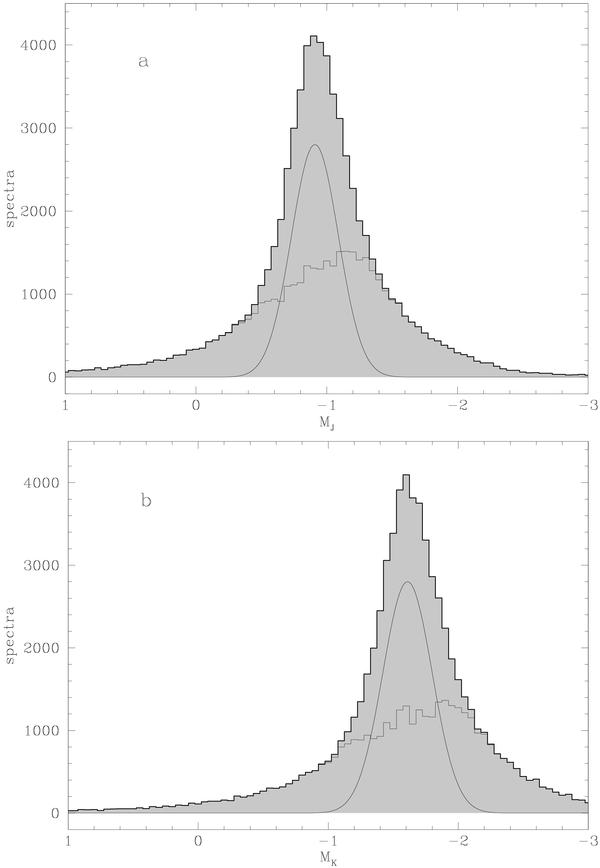
Histogram of absolute J (panel a) and K (panel b) magnitudes for red clump stars. 2MASS J and K apparent magnitudes were combined with the distance calculation using the Padova isochrone set to derive the absolute J and K magnitudes. Red clump stars are assumed to have 4500 K < Teff < 5000 K. So the top panel presents a histogram of MJ values in Fig. 5d between these two temperatures. The histogram representing all stars in this temperature interval is decomposed into an assummed Gaussian red clump peak and a smooth red giant branch contribution. For parameter values see text.
Current usage metrics show cumulative count of Article Views (full-text article views including HTML views, PDF and ePub downloads, according to the available data) and Abstracts Views on Vision4Press platform.
Data correspond to usage on the plateform after 2015. The current usage metrics is available 48-96 hours after online publication and is updated daily on week days.
Initial download of the metrics may take a while.