Fig. 5
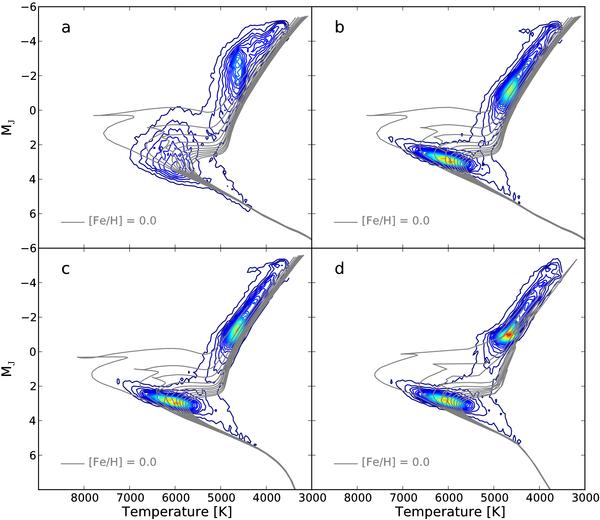
Frequency of occurence of solutions in the absolute J magnitude vs. temperature diagram for four sets of calculations: a) results from the B10 paper, b–d) new calculations using the YY, Dartmouth and Padova isochrones, respectively. All panels include the same set of 145028 spectra common to all four calculations, but the appearance of b–d) for the whole dataset of 235064 stars would be almost identical. Fifty colored isoŋ-frequency contours are linearly spaced between 20 and 1900 stars per bin with a step of 40. Each bin spans 50 K in the temperature and 0.2 mag in the magnitude direction. Gray lines trace Solar composition isochrones between 1 and 11 Gyr with a 1 Gyr spacing.
Current usage metrics show cumulative count of Article Views (full-text article views including HTML views, PDF and ePub downloads, according to the available data) and Abstracts Views on Vision4Press platform.
Data correspond to usage on the plateform after 2015. The current usage metrics is available 48-96 hours after online publication and is updated daily on week days.
Initial download of the metrics may take a while.