Fig. 11
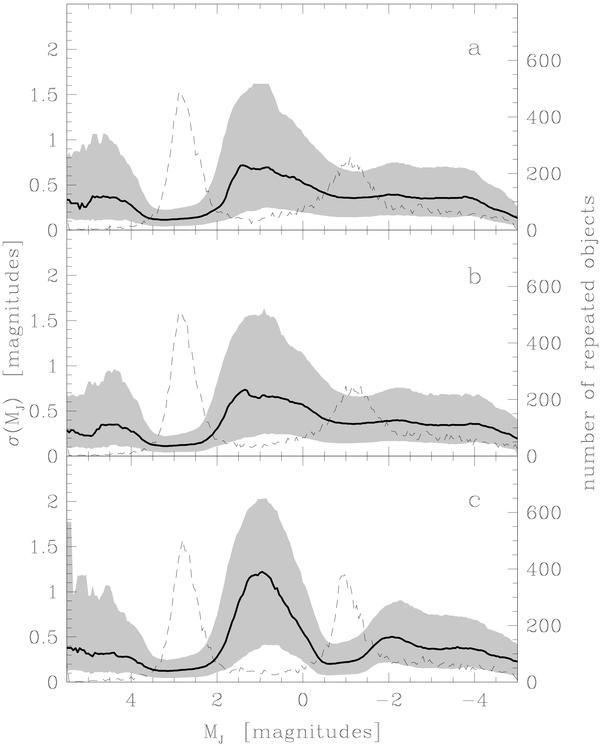
Scatter of absolute magnitudes calculated for repeated observations of the same object as a function of absolute J magnitude. Thick lines show running median errors for calculations using YY a), Dartmouth b) and Padova isochrones c). The Boxcar for the running median is ± 0.5 mag. The shaded area shows the 20 to 80 percentile range of the error distribution and the dashed line traces the number of repeated objects per 0.1 mag wide absolute magnitude bin.
Current usage metrics show cumulative count of Article Views (full-text article views including HTML views, PDF and ePub downloads, according to the available data) and Abstracts Views on Vision4Press platform.
Data correspond to usage on the plateform after 2015. The current usage metrics is available 48-96 hours after online publication and is updated daily on week days.
Initial download of the metrics may take a while.