Fig. 7
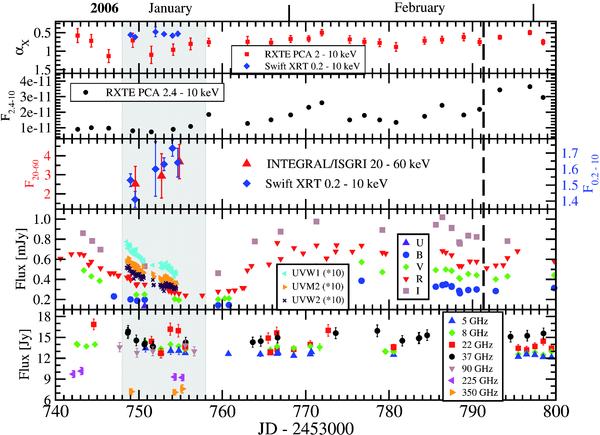
Multiwavelength light curves of 3C 279 during January and February 2006. The gray-shaded area indicates the core campaign period of the INTEGRAL, Chandra, and Swift observations; the vertical dashed line indicates the time of the MAGIC VHE γ-ray detection. Units of the X-ray fluxes are: F2 − 10 [erg cm-2 s-1] and F20−60 [10-4 ph cm-2 s-1]. The top panel shows the RXTE (2−10 keV) and Swift/XRT (0.2−10 keV) spectral indices. The RXTE data are from Chatterjee et al. (2008), updated by A. Marscher (private comm.).
Current usage metrics show cumulative count of Article Views (full-text article views including HTML views, PDF and ePub downloads, according to the available data) and Abstracts Views on Vision4Press platform.
Data correspond to usage on the plateform after 2015. The current usage metrics is available 48-96 hours after online publication and is updated daily on week days.
Initial download of the metrics may take a while.