Fig. 6
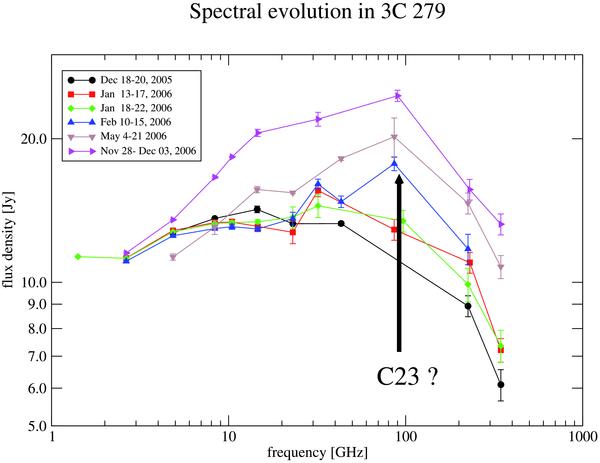
Quasi-simultaneous broad-band radio spectra of 3C 279. Different symbols and colors denote different observing epochs, as indicated by the legend box in the top left of the figure. Because of the irregular time sampling at the different observatories, the binning intervals differ from epoch to epoch. The spectrum of November 2006 was observed near the time of the peak of the 2007.0 radio flare, see Fig. 5. The solid black arrow marks the spectral flaring component, which may be associated with the new VLBI jet components C23 in Larionov et al. (2008).
Current usage metrics show cumulative count of Article Views (full-text article views including HTML views, PDF and ePub downloads, according to the available data) and Abstracts Views on Vision4Press platform.
Data correspond to usage on the plateform after 2015. The current usage metrics is available 48-96 hours after online publication and is updated daily on week days.
Initial download of the metrics may take a while.