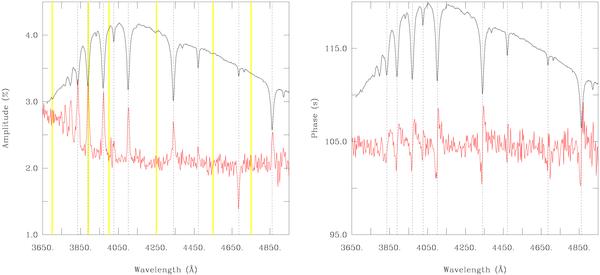
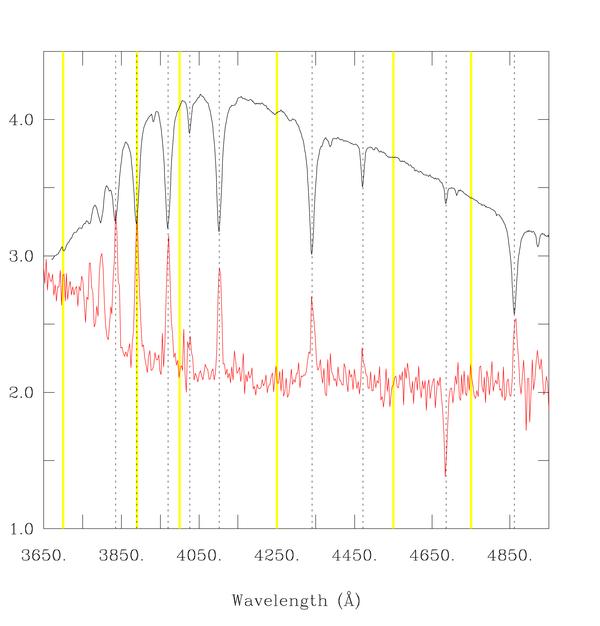
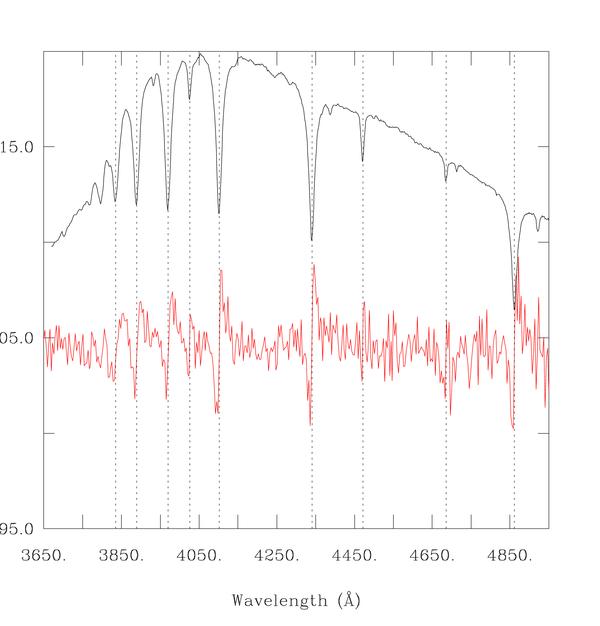
Fig. 7

Left panel: we show the observed amplitude as a function of wavelength for the dominant pulsation mode f1. For reference we plot the averaged spectrum of EC 20338−1925 on an arbitrary y-axis scale and also indicate the central wavelengths of the Balmer and prominent He lines (dotted vertical lines). The thicker yellow bars mark the wavelength bins for which the Fourier Transforms plotted in Fig. 6 were computed. Right panel: the same as the left panel, but for the observed phase.


Current usage metrics show cumulative count of Article Views (full-text article views including HTML views, PDF and ePub downloads, according to the available data) and Abstracts Views on Vision4Press platform.
Data correspond to usage on the plateform after 2015. The current usage metrics is available 48-96 hours after online publication and is updated daily on week days.
Initial download of the metrics may take a while.


