Free Access
Fig. 4
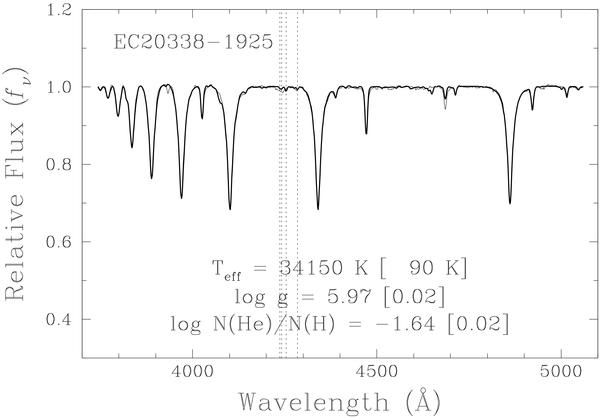
Normalised averaged spectrum for EC 20338−1925 (thin line) overplotted with the best synthetic spectrum “with metals” (thick line). The vertical dashed lines indicate the positions of the SIII, OII and NII lines thought to be present in the observed spectrum. The atmospheric parameters derived from this fit are also given.
Current usage metrics show cumulative count of Article Views (full-text article views including HTML views, PDF and ePub downloads, according to the available data) and Abstracts Views on Vision4Press platform.
Data correspond to usage on the plateform after 2015. The current usage metrics is available 48-96 hours after online publication and is updated daily on week days.
Initial download of the metrics may take a while.