Fig. 10
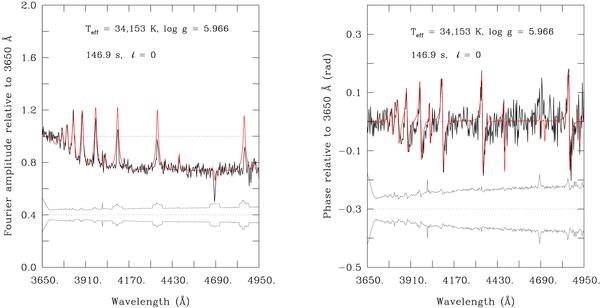
Left panel: we show the normalised observed amplitude for f1 (black curve) together with the errors on the data points (thin curves shifted downwards along the y axis for clarity). The theoretical monochromatic amplitude as calculated for a radial mode with P = 146.9 s and model parameters characteristic of EC 20338−1925 is overplotted (red curve). Right panel: similar to the left panel, but referring to the monochromatic phase. The theoretical monochromatic phase was computed using the same parameters as for the amplitude, and additionally a radial velocity shift of 11 km s-1 was assumed.
Current usage metrics show cumulative count of Article Views (full-text article views including HTML views, PDF and ePub downloads, according to the available data) and Abstracts Views on Vision4Press platform.
Data correspond to usage on the plateform after 2015. The current usage metrics is available 48-96 hours after online publication and is updated daily on week days.
Initial download of the metrics may take a while.