Fig. 4
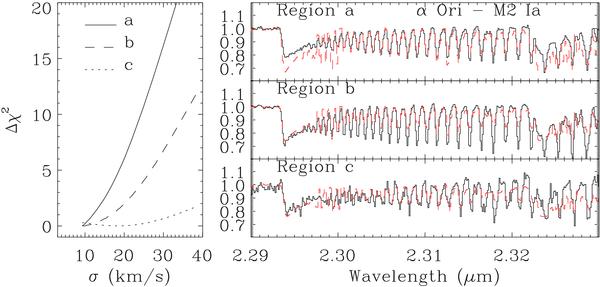
Results of the χ2 fits to the CO absorption in Orion with the high-resolution infrared spectrum of α Ori (Wallace & Hinkle 1996). In the left side panel we show the Δχ2 curves as a function of the ΔV used to smooth the library spectrum. On the right we show the comparison between the observed spectrum in each of the three regions (full lines) with the best-fitting photosphere (dashed lines, corresponding to the Δχ2 minima in the left-hand side plot).
Current usage metrics show cumulative count of Article Views (full-text article views including HTML views, PDF and ePub downloads, according to the available data) and Abstracts Views on Vision4Press platform.
Data correspond to usage on the plateform after 2015. The current usage metrics is available 48-96 hours after online publication and is updated daily on week days.
Initial download of the metrics may take a while.