Fig. 3
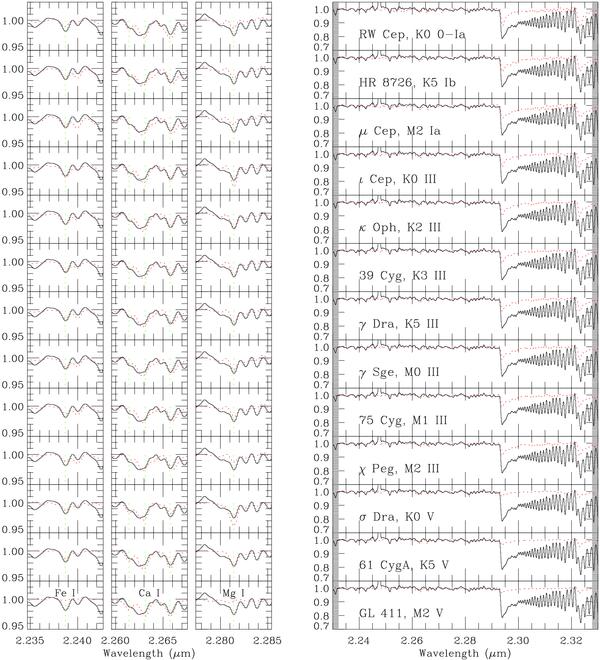
Comparison between our average reflected spectrum (solid line) and the stellar spectra from Kleinmann & Hall (1986, red dotted lines). In the left panels we show enlargement around the lines of Fe I, Ca I, and Mg I (the wavelength of each feature is marked with a vertical green dotted line), and on the right side we show the full wavelength range of our spectrum, and the name and spectral type of the stars are marked in the right side panels.
Current usage metrics show cumulative count of Article Views (full-text article views including HTML views, PDF and ePub downloads, according to the available data) and Abstracts Views on Vision4Press platform.
Data correspond to usage on the plateform after 2015. The current usage metrics is available 48-96 hours after online publication and is updated daily on week days.
Initial download of the metrics may take a while.