Fig. 9
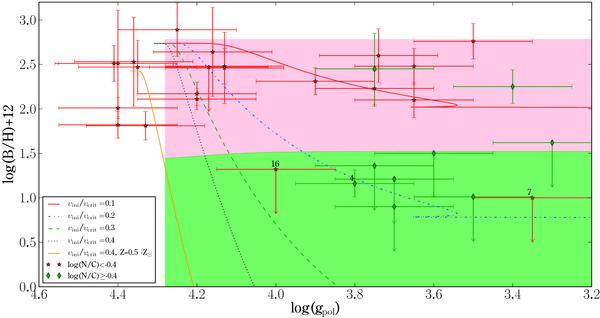
Surface boron abundances plotted versus polar gravity for 12 M⊙ models with initial υini/υcrit between 0 and 0.4. The orange continuous curve corresponds to the 12 M⊙ with Z = 0.007. Different kinds of points are used for stars with various surface N/C ratios. The labelled stars correspond to objects discussed in the text. The colour map depicts the same division in log(N/C) regimes as the observations going from low (top) to high (bottom) values.
Current usage metrics show cumulative count of Article Views (full-text article views including HTML views, PDF and ePub downloads, according to the available data) and Abstracts Views on Vision4Press platform.
Data correspond to usage on the plateform after 2015. The current usage metrics is available 48-96 hours after online publication and is updated daily on week days.
Initial download of the metrics may take a while.