Fig. 9
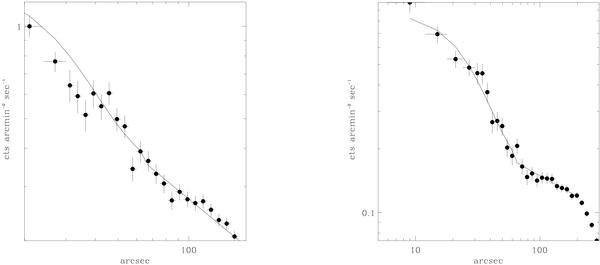
Left panel: summed MOS and pn surface brightness profile across the cold front in the A1 sector of subcluster A shown in Fig. 2, together with the best-fit model of a power law to describe the outer ICM and a β-model to describe the density inside the edge. Right panel: same as the left panel for the cold front in sector B1 of subcluster B.
Current usage metrics show cumulative count of Article Views (full-text article views including HTML views, PDF and ePub downloads, according to the available data) and Abstracts Views on Vision4Press platform.
Data correspond to usage on the plateform after 2015. The current usage metrics is available 48-96 hours after online publication and is updated daily on week days.
Initial download of the metrics may take a while.