Fig. 7
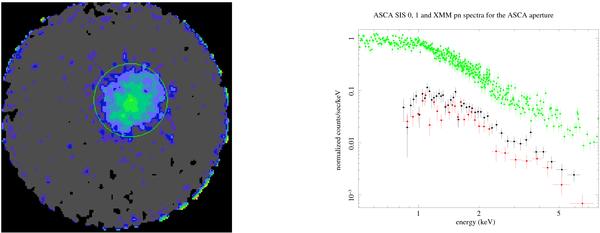
Left panel: exposure-corrected ASCA GIS image of Abell 2028. The regions inside the solid green lines (R = 7′) were extracted for the source spectrum analyzed in Baumgartner et al. (2005). Figure taken from http://asd.gsfc.nasa.gov/Donald.Horner/acc/html/ABELL_2028_83040050.html. Right panel: comparison of the X-ray spectra of the large ASCA aperture from the ASCA SIS 0 and 1 detectors (black and red, respectively) and from the EPIC pn (green).
Current usage metrics show cumulative count of Article Views (full-text article views including HTML views, PDF and ePub downloads, according to the available data) and Abstracts Views on Vision4Press platform.
Data correspond to usage on the plateform after 2015. The current usage metrics is available 48-96 hours after online publication and is updated daily on week days.
Initial download of the metrics may take a while.