Fig. 5
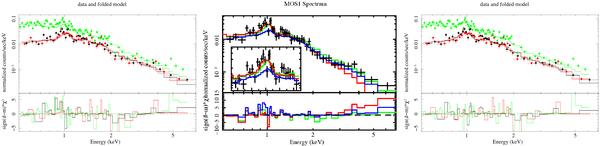
Left panel: X-ray spectrum of the core of the main subcluster of Abell 2028 taken from a 0.5′ aperture (corresponding to region 1 of Fig. 4). Data from MOS1, MOS2, and pn are plotted in black, red, and green, respectively. The best-fit model obtained from a 1T fit in the broad band 0.5 − 10 keV and residuals are also shown. Central panel: MOS 1 spectrum from the inner core corresponding to region 1. Three different spectral models are overplotted: the 1T model (green line) fitted in the broad 0.5 − 10 keV band; the 1T model fitted in the 0.5 − 3 keV band (red line) and the 1T model with the parameters obtained by the 0.5 − 10 keV fit, but with the abundance value kept fixed at the lower value obtained in the 0.5 − 3 keV band (blue line). Right panel: same as in the left panel with the best-fit 2T model (with the higher temperature fixed at 5 keV) in the 0.5 − 10 keV band.
Current usage metrics show cumulative count of Article Views (full-text article views including HTML views, PDF and ePub downloads, according to the available data) and Abstracts Views on Vision4Press platform.
Data correspond to usage on the plateform after 2015. The current usage metrics is available 48-96 hours after online publication and is updated daily on week days.
Initial download of the metrics may take a while.