Fig. 4
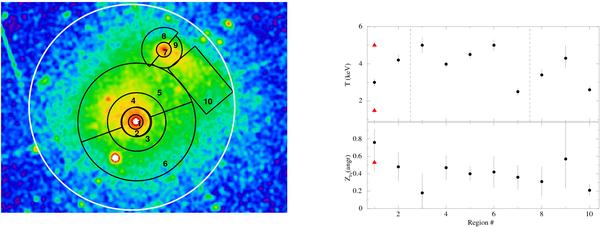
Left panel: regions used for spectral extraction to derive the temperature and abundance maps. The white circle corresponds to the ASCA aperture. Right panel: black circles correspond to the values and 1σ error bars for the temperature and abundances obtained with the 1T model for each region shown in the left panel, discussed in the text in Sect. 4.1. The dashed vertical lines indicate the regions adjacent to the surface brightness jumps of Fig. 2. The red triangles correspond to the values for temperature and abundance obtained with a 2T model, as discussed in the text in Sect. 4.2. The higher temperature value at 5 keV has been fixed.
Current usage metrics show cumulative count of Article Views (full-text article views including HTML views, PDF and ePub downloads, according to the available data) and Abstracts Views on Vision4Press platform.
Data correspond to usage on the plateform after 2015. The current usage metrics is available 48-96 hours after online publication and is updated daily on week days.
Initial download of the metrics may take a while.