Fig. 3
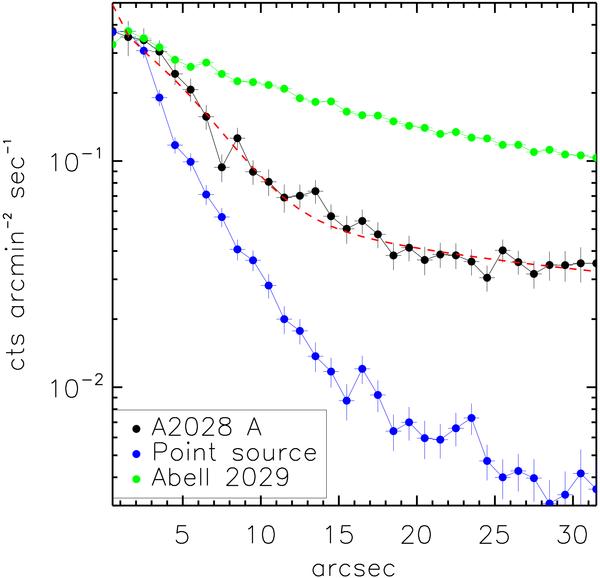
Surface brightness profile of the core of subcluster A of A2028 compared to the one of the bright point source SE of the subcluster and to the A2029 cluster, one of the clusters with the most peaked surface brightness profile. The profiles have been scaled to match the peak of the radial profile of A2028 A: the point source profile was multiplied by 0.29 and the A2029 profile by 0.058. The dotted red line corresponds to the best-fit Gaussian+power-law model of the profile of the core of A 2028 A discussed in the text.
Current usage metrics show cumulative count of Article Views (full-text article views including HTML views, PDF and ePub downloads, according to the available data) and Abstracts Views on Vision4Press platform.
Data correspond to usage on the plateform after 2015. The current usage metrics is available 48-96 hours after online publication and is updated daily on week days.
Initial download of the metrics may take a while.