Fig. 2
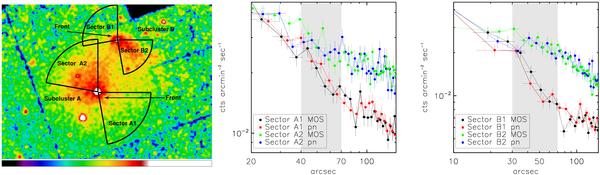
Left panel: exposure-corrected MOS image in the 0.5 − 2 keV band with the angular sectors used to extract the surface brightness profiles shown in the other panels. Point sources were masked when extracting the profiles. The positions of the surface brightness jumps discussed in the text and shown in the next panel are indicated by arrows. Center panel: surface brightness profiles for the selected angular sectors shown in the left panel for the main subcluster A. The radial ranges where surface brightness profiles change rapidly because of the surface brightness jumps are indicated by the shaded gray area. Right panel: same as the center panel, but for the smaller subcluster B.
Current usage metrics show cumulative count of Article Views (full-text article views including HTML views, PDF and ePub downloads, according to the available data) and Abstracts Views on Vision4Press platform.
Data correspond to usage on the plateform after 2015. The current usage metrics is available 48-96 hours after online publication and is updated daily on week days.
Initial download of the metrics may take a while.