Free Access
Fig. A.2
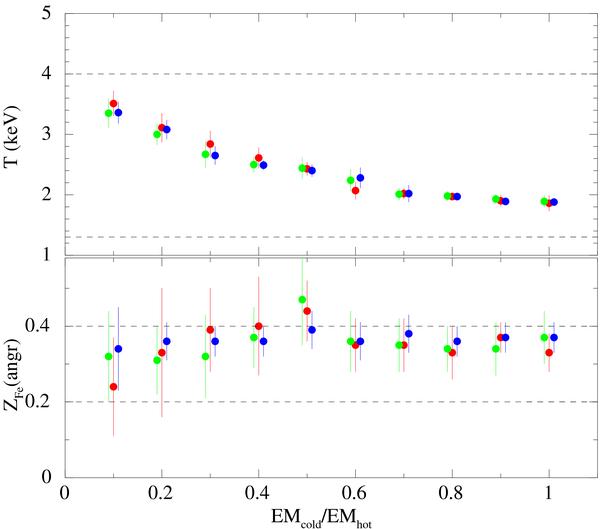
Same as in Fig. A.1 for the simulations s2. Note the two lines in the abundance panel which refer to the two different input abundances in the two components: the higher one (0.4 Z⊙) in the cold component and the lower one (0.2 Z⊙) in the hot component.
Current usage metrics show cumulative count of Article Views (full-text article views including HTML views, PDF and ePub downloads, according to the available data) and Abstracts Views on Vision4Press platform.
Data correspond to usage on the plateform after 2015. The current usage metrics is available 48-96 hours after online publication and is updated daily on week days.
Initial download of the metrics may take a while.