Fig. A.1
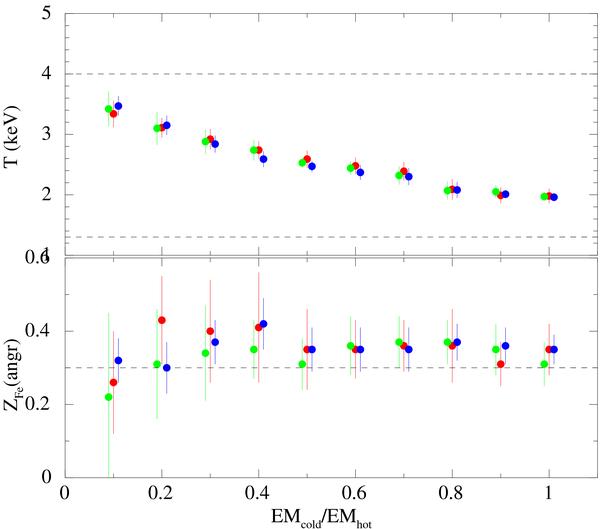
Median of the best-fit temperature and abundance distribution as a function of the ratio of the cold and hot emission measure, for the simulation s1. The green dots refer to M1 results, the red dots to M2 and the blue dots to pn. The dashed lines refer to the input values of temperature and abundance for the two components. The error bars correspond to the mean absolute deviation.
Current usage metrics show cumulative count of Article Views (full-text article views including HTML views, PDF and ePub downloads, according to the available data) and Abstracts Views on Vision4Press platform.
Data correspond to usage on the plateform after 2015. The current usage metrics is available 48-96 hours after online publication and is updated daily on week days.
Initial download of the metrics may take a while.