Free Access
Fig. 4
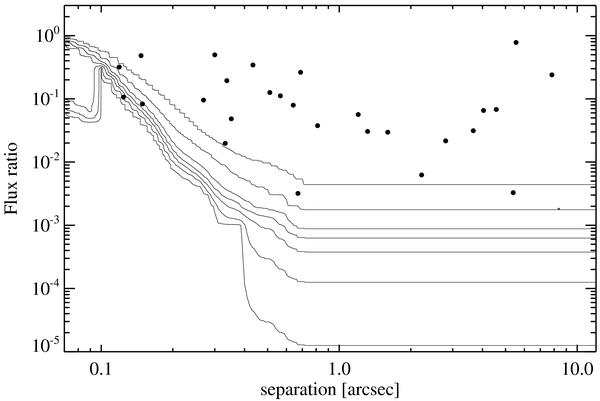
Completeness map for our survey. The lines represent the completeness of our observations as derived from the sensitivity limit for undetected companions (see Sect. 3.1). The lines are, from top to bottom, 99%, 90%, 70%, 50%, 30%, 10%, and 1% completeness. The circles represent the binaries found in our study.
Current usage metrics show cumulative count of Article Views (full-text article views including HTML views, PDF and ePub downloads, according to the available data) and Abstracts Views on Vision4Press platform.
Data correspond to usage on the plateform after 2015. The current usage metrics is available 48-96 hours after online publication and is updated daily on week days.
Initial download of the metrics may take a while.