Fig. 2
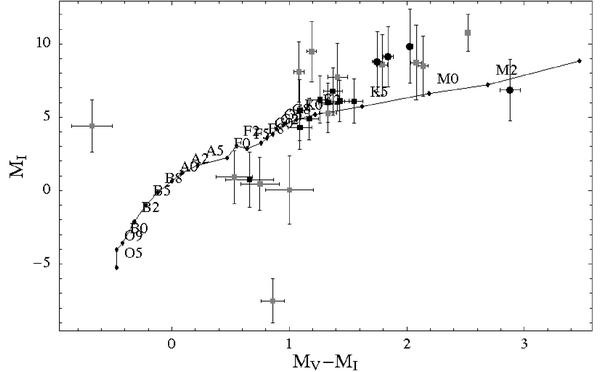
Absolute color–magnitude diagram. Filled black circles denote the most promising M-type candidates. The filled black squares denote promising candidates around F- and/or G-type stars. On the other hand, discarded candidates are represented by grey filled squares. Error bars correspond mainly to distance uncertainties. The main-sequence stars loci are plotted as a solid black line.
Current usage metrics show cumulative count of Article Views (full-text article views including HTML views, PDF and ePub downloads, according to the available data) and Abstracts Views on Vision4Press platform.
Data correspond to usage on the plateform after 2015. The current usage metrics is available 48-96 hours after online publication and is updated daily on week days.
Initial download of the metrics may take a while.