Fig. 10
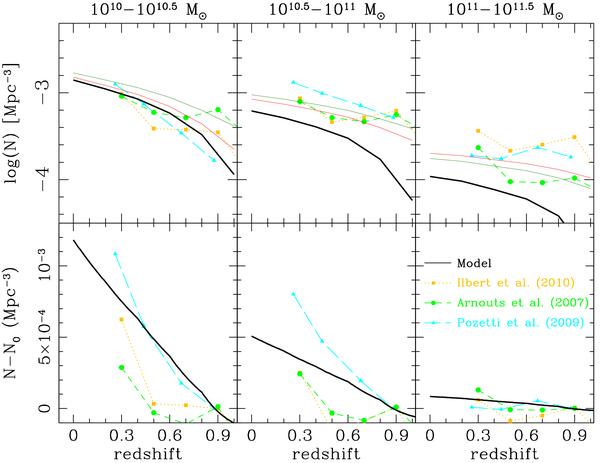
Top: modeled evolution of the number density of quiescent galaxies (solid curves) in three stellar mass bins (left to right: 1010−10.5 M⊙, 1010.5−11 M⊙ and 1011−11.5 M⊙) cumulated since redshift 1.1, compared to the data of Pozzetti et al. (2009) for the same mass ranges as the long dashed curves with triangles. We integrated the observed SMF of Ilbert et al. (2010) and Arnouts et al. (2007) within the same mass bins, the dotted with squares and dashed with circles curves). We also show as two thin solid curves how the model curve is shifted if we add to the newly quenched galaxies the number of quiescent galaxies already present at z = 1.1 according to the observed SMF of Ilbert et al. (2010) and Arnouts et al. (2007). Bottom: differential number density evolution in the same mass ranges (N0 is the number density at redshift 0.9 in both the data and the model). See Sect. 4.2 for details.
Current usage metrics show cumulative count of Article Views (full-text article views including HTML views, PDF and ePub downloads, according to the available data) and Abstracts Views on Vision4Press platform.
Data correspond to usage on the plateform after 2015. The current usage metrics is available 48-96 hours after online publication and is updated daily on week days.
Initial download of the metrics may take a while.