Fig. 4
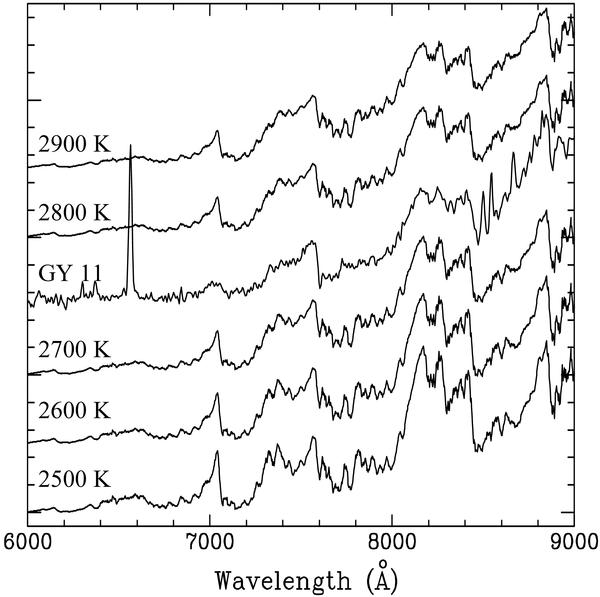
Comparison of the spectrum of GY 11 with the synthetic spectra of objects with log g = 3.5 and different Teff. A spectrum with Teff = 2700 K produces the best fit. Given that no spectrophotometric calibration of the GY 11 spectrum was possible with the available data (Sect. 3), the combined effects of reddening and wavelength-dependent instrumental response on the spectrum of GY 11 have been accounted for by computing the ratio of a low-order polynomial fit to it and to the original synthetic spectra. The synthetic spectra have then been multiplied by this ratio, and the results are the spectra displayed in the figure. In this way the overall slopes of the spectra of GY 11 and the comparison spectra are the same, which facilitates their comparison.
Current usage metrics show cumulative count of Article Views (full-text article views including HTML views, PDF and ePub downloads, according to the available data) and Abstracts Views on Vision4Press platform.
Data correspond to usage on the plateform after 2015. The current usage metrics is available 48-96 hours after online publication and is updated daily on week days.
Initial download of the metrics may take a while.