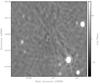
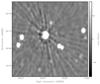
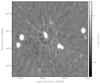
Fig. 3
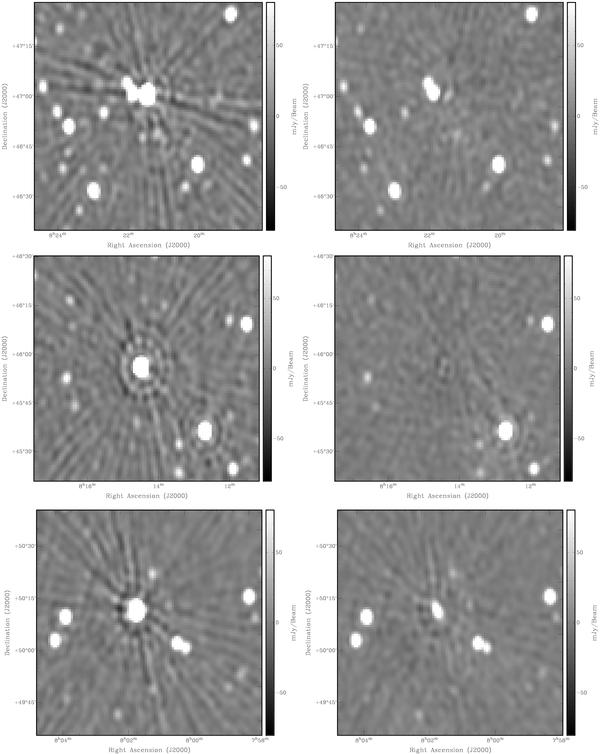
From top to bottom: the left column shows a zoomed-in image around 3C197.1, 4C +46.17 and 6C B075752.1+501806 respectively which highlights their different spiky patterns due to non-isoplanaticity in the ionosphere. The right column shows the residual images after the sources have been peeled off. The images represent an average of the seven spectral bands of the 3C 196 data.
Current usage metrics show cumulative count of Article Views (full-text article views including HTML views, PDF and ePub downloads, according to the available data) and Abstracts Views on Vision4Press platform.
Data correspond to usage on the plateform after 2015. The current usage metrics is available 48-96 hours after online publication and is updated daily on week days.
Initial download of the metrics may take a while.