Fig. 18
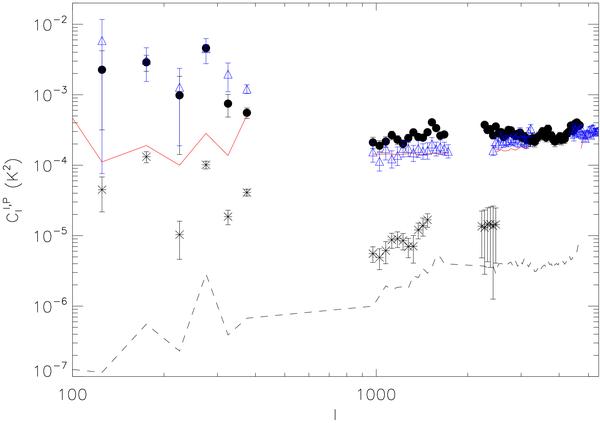
Power spectra of the total intensity 3C 196 field (black filled circles), of the NCP field (blue triangles), of the confusion noise (solid red line), of the polarization in the 3C 196 area (black asterisks) and of the instrumental noise for the 3C 196 data (dashed black line). The noise power spectrum is determined through the simulations described in (4.1). The error bars account for both the statistical and the instrumental noise and are at 2σ and 1σ confidence level for the total intensity and the polarization respectively. The noise has been subtracted from the total intensity power spectra but not from the polarization power spectrum.
Current usage metrics show cumulative count of Article Views (full-text article views including HTML views, PDF and ePub downloads, according to the available data) and Abstracts Views on Vision4Press platform.
Data correspond to usage on the plateform after 2015. The current usage metrics is available 48-96 hours after online publication and is updated daily on week days.
Initial download of the metrics may take a while.